We provide various solutions that support digital transformation

myInvenio

Key features

myInvenio features to identify trends, patterns and details of how a process unfolds.

Business Process Visualization

Business Process Visualization

Based on logs and system data obtained from core and information systems, a flow diagram of business processes will be generated. Process and pattern visualization of the current business is the first function used in process mining. Processes are visualized in terms of "frequency (number of processes)" and "numerical values (lead time between processes, average, maximum, minimum, and median of processing time of each process)".

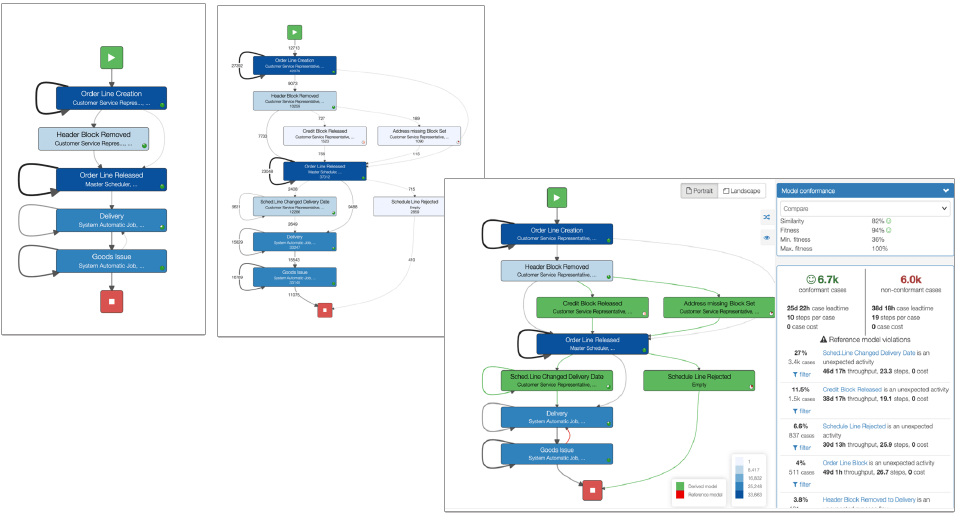
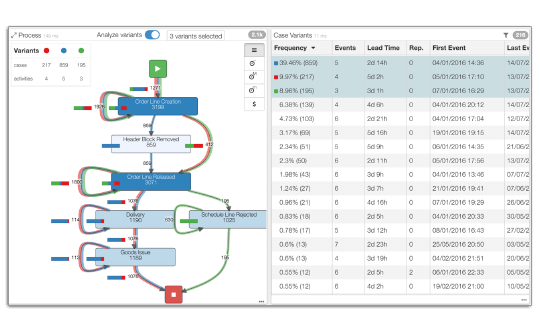
Standard Process Compliance Check (conformance inspection)

It compares the predefined standard process (to-be) with the current process (as-is) obtained from log files, visualizes the deviations, and calculates the deviation rate as data. By visualizing unexpected business processes, the number of reprocesses, and the business history of unexpected people, it is possible to understand the compliance level and the penetration of internal business standardization.

Standard Process Compliance Check
KPI Setting

KPI Setting

By setting the KPI (Key Performance Indicator) defined for each business as a parameter, the target achievement rate calculated from the actual data and the performance of each department and individual can be easily visualized.

Analysis Dashboard

Displays a summary of process performance calculated from logs. By understanding the bottlenecks in the overall process, customers can plan business improvements and optimize internal resources.

Example: Internal operations that tend to be "reworked many times".
Internal departments and personnel who are "slow to respond".
Suppliers with "cumbersome payment processes".

Analysis Dashboard
Process Animation

Process Animation

The process flow can be visualized by animation. The processes indicated by tokens (red circles) on the map move through the flow at a speed corresponding to the lead time. It is possible to visually understand bottlenecks where tokens are stagnant and critical paths where token inflows are concentrated.

Relationship Chart

We analyze the process from the viewpoint of business executors. In addition to understanding the individuals and departments where work is concentrated, it is also possible to visualize the relationship between business executors by using correlation diagrams such as "who (which department) and who (which department) are working together" or "who (which department) and who (which department) are working closely".

Relationship Chart<

Data Integration

By using plug-ins that integrate myInvenio with existing databases (SQL Server, Oracle, SAP, Infor, etc.) and BI (Qlik, PowerBI, etc.), seamless mining with existing data is possible.

Business Process Analysis

BPMN(Business Process Model and Notation -It is also possible to define standard processes using Business Process Modeling Notation-(BPMN 2.0 compliant)).

Business Process Analysis

It all starts with process analysis with myInvenio

We start with a bird's-eye view of the entire business process through visualization of the current business. Next, in addition to narrowing down the problem areas in the process that become business issues, we analyze exceptional factors that induce problematic processes that would not normally occur.

    Example of an tasks:
  • What are the processing patterns that result in order processing with better than average performance?
  • Why is there a concentration of purchases from certain suppliers?
  • Why does it take significantly longer for only certain items to be delivered?

Process Intelligence

As an approach to solving problems, we create intelligence reports that comprehensively display the results of multifaceted data analysis. From the report, it is possible to perform data drill-down by attribute, multifaceted analysis of segmented data, and analysis that aggregates multifaceted data. It is also possible to create customized reports according to the perspective of each person in charge of data analysis.

Process Intelligence
Process Pattern Comparison

Process Pattern Comparison

Calculate the number of business patterns performed from the start of business to the end. The most frequent business patterns and efficient patterns with short lead times (Happy Paths) are defined as the base of standard processes, and the time and cost required for inefficient processing are calculated by comparing them with "non-standard" patterns where unexpected or redundant processing occurs.

Dashboard

Customize reports using a dashboard system. By allowing each user to customize their own reports, it is possible for multiple persons in charge to analyze from different perspectives simultaneously.A wide variety of report formats are available as components, allowing users to configure a small number of reports to focus on a certain hypothesis test or multiple reports to analyze from multiple perspectives.Report components can be dragged and dropped in the browser for easy customization.

Dashboard
Custom Report

Custom Report

Create reports that take into account the user's own conditions, allowing customization from the user's own perspective, such as overlapping and comparing multiple attribute data using simple functions similar to Excel functions.

Individual process paths and forecasting

In order to analyze the details of a specific process (case), it is possible to display the process path of a single process. Also, for processes that are judged to be "incomplete," it is possible to simulate the process flow that may occur in the future and display the predicted path.

Individual process paths and forecasting

New Features

  • Customizable analytical dashboards
  • Frequently used graphs (pie chart, vertical and horizontal line chart, bubble chart, etc.)
  • Real-time high-speed filtering
  • Customizing process data display queries
  • Variant (Pattern) filtering
  • Graphical comparison of variants (patterns) using frequency/time/cost/KPI
  • Process Correlation Diagram
  • Display of individual process paths and process path simulation of unprocessed parts.

日本語

Page navigation