-
製品&サービス
- Customer Experience
マルチデバイスに対応したCMS、ヘッドレス対応と、先進機能を全て搭載し、フルマネージドクラウド上で動作する、10年連続No1※のCMS
企業の広報・宣伝・販促・営業活動における媒体のコンテンツ制作に関わるあらゆる情報を一元管理し、コンテンツ制作の生産性を向上
静止画を撮影し、360度のVR空間を構築出来るソリューション。安価に早くサービスを提供可能。ブラウザで閲覧できる3D-VR
- Digital Transformation
プロセスマイニングとタスクマイニングを最大限に活用。正確な現状分析と最適な解決手段を発見し、会社全体の最適化へつなげます。
見えなかった業務プロセスを自動的に一瞬で可視化
業務のタスクレベルでの活動を事実に基づき可視化
WindowsPC、MAC、Lunixどんな環境でも利用可能なRPA。大規模な運用にも耐えられる製品
- Data Base
MariaDBは、MySQLの派生版として誕生したデータベース。レプリケーションの並列処理による性能向上、複数マスターによるレプリケーション、グローバルトランザクションIDの採用によるサーバーの柔軟な切り替えが可能
世界中の多くの企業が使用しているデータベース管理システムです。大容量のデータも高速に動作を行えるため、WEBサイト や検索エンジンでも多く使用されています。
- Service
Webサイト運用のあらゆる課題を解決。マーケティング戦略、SEO対策、UI/UX改善、セキュリティ強化など幅広い支援で、Web運用の課題を解決し企業のデジタル戦略を強化します。
- Customer Experience
- ソリューション
- イベント•セミナー
- ニュース&トピックス
- お客様事例
- 企業情報
-
 03-6409-6966
お問い合わせ
採用情報
03-6409-6966
お問い合わせ
採用情報
-
- English アクセス
-


ソリューション タスクマイニング利用イメージと機能詳細
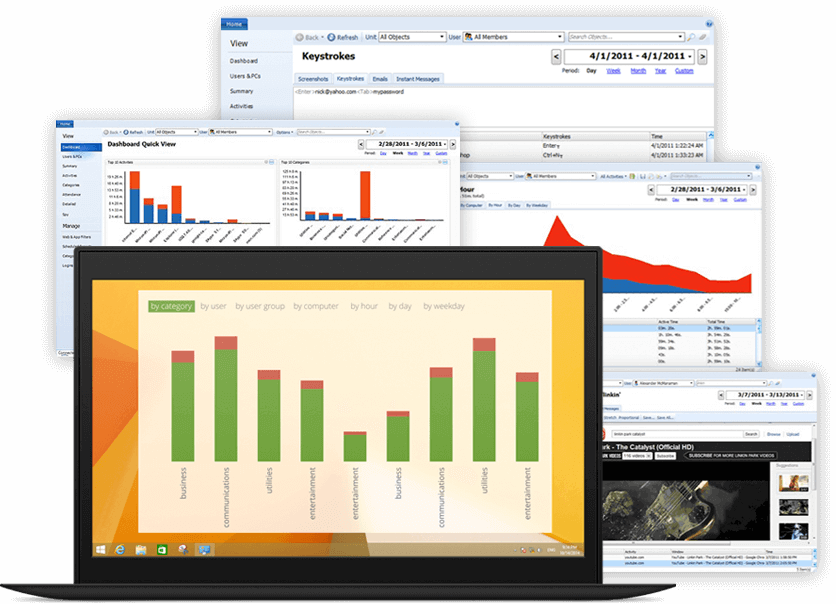
ハートコア タスクマイニング Controlio 利用イメージ
CASE01:リモートワーク(テレワーク)での業務改善
「忙しくて、そんな仕事できません」
そんなことを言いながら、実は業務時間にゲームをやっていたり、チャットで長時間雑談を楽しんでいたり、テレビや雑誌を読んだり。
ハートコア タスクマイニング Controlioは「いつ、何のアプリケーションを開き、それが何時間アクティブになっていたか」など細かな抽出が可能です。
無駄な待機時間を減らすことで、結果として業務コスト削減→利益率の改善をもたらします。また、情報セキュリティをよく意識した利用方法ができるので、リモート作業中の機密ファイルの利用が不安にならない仕組みをご提供しています。
CASE02:RPA導入のための事前分析
RPA導入企業の約6割がその導入に満足しておらず、3割の企業が導入に失敗したというデータがあります。 ハートコア タスクマイニング ControlioではPCの操作ログというファクトデータを抽出するので、本当に時間がかかっている作業は何で、それに紐づくプロセスは妥当なのかどうか等のドリルダウン分析が可能です。 RPA導入時のリスク軽減へとつながります。
CASE03:業務ボトルネックの発見と改善
冗長であったり、不必要なプロセスを排除することで業務プロセス自体が最適化されることに加えて、スタッフのアイドルタイムが削減されます。 さらに、待ち工数や、繰り返し作業等の無駄な時間を削減することで、業務効率が向上し、残業時間の短縮にもつながります。
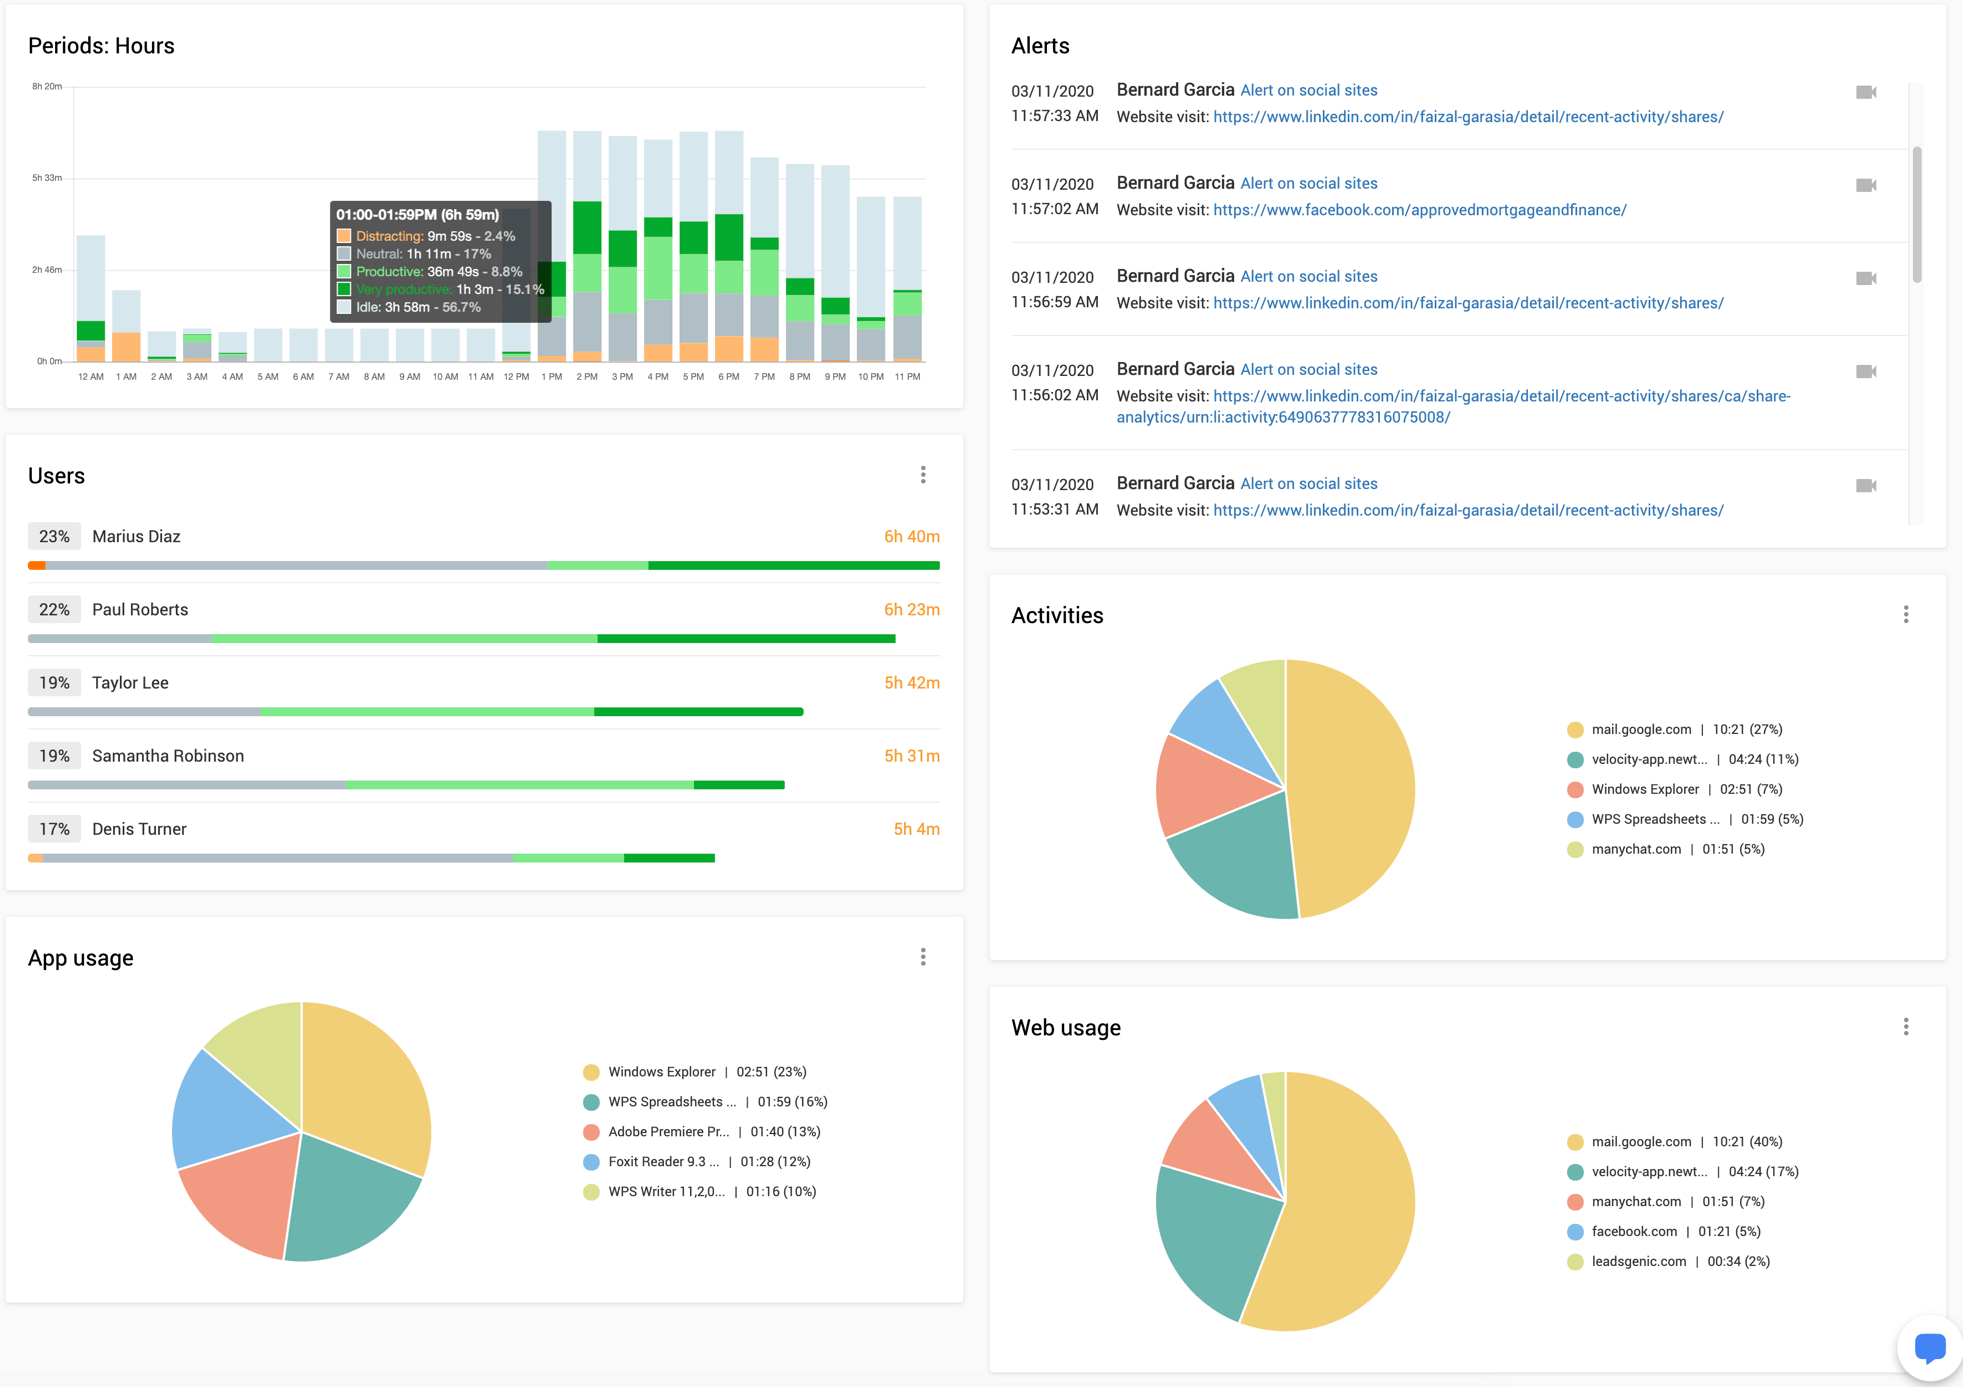
ハートコア タスクマイニング Controlio 分析レポート
ハートコア タスクマイニング Controlioでは業務改善に必要な様々なレポートを出力します。
アクティビティ
アプリケーションやWebサイトの利用などの従業員のアクティビティごとの時間分布を表示します。 アクティビティをカテゴリと生産性レベルに分けて表示し、どの 組織でどのアクティビティに時間をかけているかが明確になります。
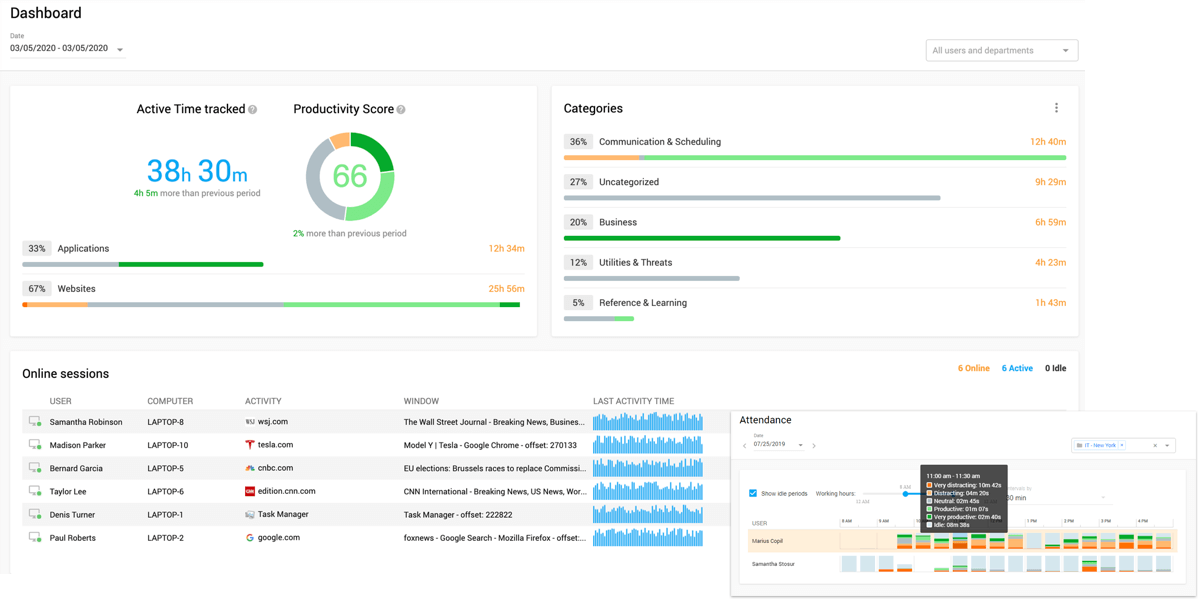
勤務
従業員の1日の活動を確認し、労働時間中の生産性を測定します。選択した期間おけるすべての従業員の勤務状況を詳細に確認できます。 従業員の名前の横にあるアクティビティ画像をクリックすると、従業員が休憩中、勤務中、生産的、中立的、または気が散っている時間の割合を表示します。 従業員がアクティブな時間に何をしていたかを正確に確認できます。また、レポートの稼働日と集計期間の長さを設定できます。
カテゴリ
アクティビティの概要レポートにグループ化された業務を表示できます。従業員がどのプロセスに時間を費やしているかをすぐに確認できます。グラフで視覚化されているので、ビジネスとソーシャルネットワーキングの時間を簡単に比較できます。 エンターテイメントに移動して、ブラックリストに登録されたWebサイトを表示したかどうか確認ができます。
ユーザ
すべての従業員の比較が表示されます。誰が最も活動的で、誰がコンピューターから離れて仕事しているか確認ができます。グラフの下のユーザ名をクリックすると、選択したユーザのアクティビティレポートページが表示されます。
生産性
生産性スコアは、チームの生産性レベルを測定します。生産性のレベルはパーセンテージとして計算され、生産性の範囲は0%〜100%です。この指標は、チームのアプリケーションの利用記状況やウェブサイトの積極的な使用を監視および測定することによって計算されます。計算は時間単位で測定され、その後、チームの時間を非常に生産的、生産的、中立的、気が散る、または気を散らすものとして表示するパラメーター(「生産性レベル」)に分類されます。 メトリックをパーセンテージで表示します。パラメータの見出しを1回クリックするだけで、生産性のすべてのカテゴリに関するより詳細なレポートにアクセスできます。たとえば、どのアクティビティがチームにとって生産的で、どれが気を散らすものであったかを正確に見つけることができます。これにより、チームがどのように時間を費やすべきかについて、十分な情報に基づいた決定を下すことができます。
検索
このレポートには、組織内のすべてのユーザの検索フレーズと検索エンジン名が表示されます。 このレポートは、Webアクティビティとは別に、会社の問題を特定したり、特定のタスクの問題を理解したりするための優れたレポートです。
ファイル
USBドライブは、セキュリティの観点からも大きな問題となっています。また、ファイルを外部のストレージに持ち出すことも大きな問題です。チームメンバーがプライベートフラッシュドライブに作業を保存して会社の知的財産を盗むリスクです。さらに、組織で最も重要なセキュリティ対策の1つは、ウイルスまたはマルウェアプログラムをITシステムから排除する必要があることです。これらの悪意のあるコンピューターのウイルスは、メールや、外部ストレージ、WEBからを簡単に感染し、大きな被害をもたらします。 ファイルレポートには、アクセスするすべてのコンピューターでチームメンバーが行ったすべてのファイルアクションが表示されます。ファイルを作成、名前変更、コピー、または削除したユーザを正確に知ることができます。フラッシュドライブの操作と検索操作のみを表示するには、リムーバブルチェックボックスフィルターを使用して、パスまたはファイル名を検索が可能です。すべてのレコードは静止画もしくは、動画録画にリンクされているため、特定の検索要求を実行するビデオ断片を数秒で見つけることができます。
メール
電子メール監視機能は、電子メールの使用に関して、チームの生産性を理解するのに役立ちます。 電子メールレポートは、チームメンバーごとの通信生産性のビューを提供します。 従業員から/に送信される通信の量を確認できます。監視する必要があるチームメンバーまたはサブ部門と、各レポートの特定の期間を選択できます。
印刷
印刷は、組織の知的財産のセキュリティに対するもう1つのリスクです。管理されていない印刷は、運用コストを増やし、効率を低下させる可能性もあります。システムから取得できるもう1つの詳細レポートを使用して、チームの印刷を監視および管理するのに役立ちます。印刷レポートでは、各チームメンバーが何をどのくらい印刷しているのかを確認できます。これは、不必要な支出を抑制し、チームの知的財産のセキュリティを高めるのに役立ちます。
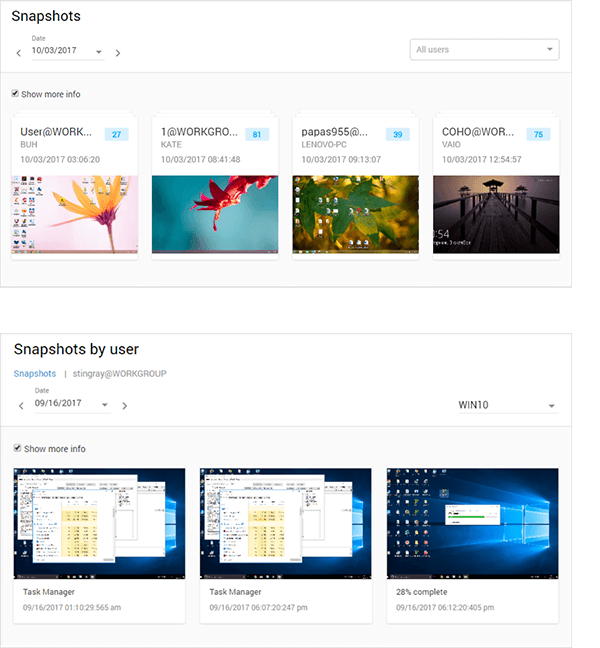
ハートコア タスクマイニング Controlio 管理者のための機能
各ユーザの利用状況を横断的に閲覧することが可能です。
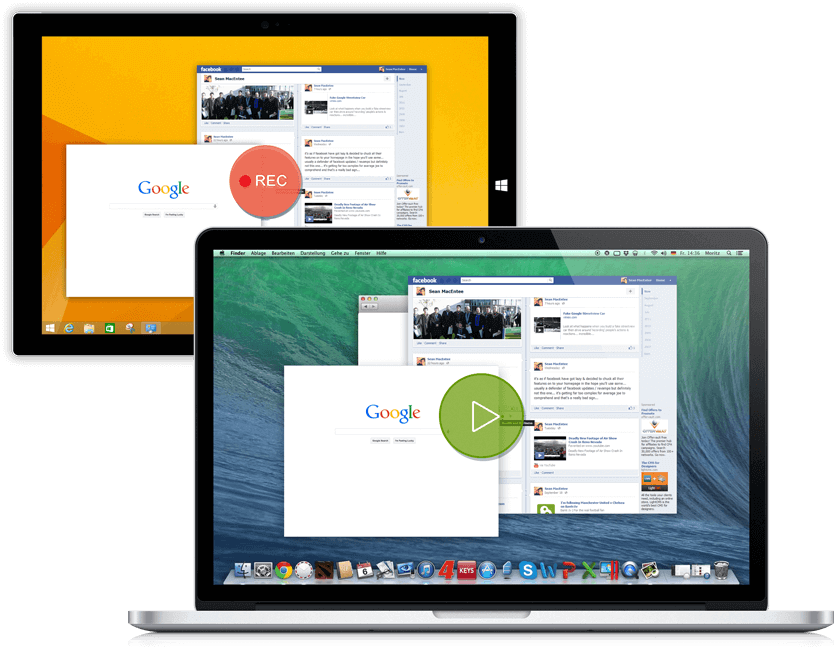
各ユーザの利用状況や画面操作を、静止画でキャプチャーしたり、動画で録画したり、管理者が再生を行うことが可能です。
ハートコア タスクマイニング Controlio セキュリティに関する機能
行動アクション監視機能
・行動アラート
社内で禁止されているWebサイトまたはその他のアクション(Facebook、USBリムーバブルUSBなどのソーシャルメディアサイトなど)が勤務時間中に行われたときの記録が表示されます。 このセクションには、イベントの時間、ユーザの名前、コンピューター、および違反(イベント)の種類の情報が表示されます。
・行動ルール
従業員のルールを作成して、チームの効率と生産性を向上させることができます。 たとえば、ゲームアプリケーションへのアクセスをブロックしたり、特定のインターネットキーワード検索を禁止したりできます。すべてのルールがトリガーされると、アラートレポートのアラートが作成されます。 また、あらゆる種類のアクティビティをブロックするルールを作成することも、ブロックせずにアラートのみを収集することもできます。
たとえば、訪問したウェブサイト、入力されたキーストローク、特定のアプリケーションの起動、USBメディアが挿入等を禁止することが可能です。
各ルールに必要かつ固有のこれらのオプションを設定する必要があります。
Webフィルタリング
任意のアクションを制御可能です。
ハートコア タスクマイニング Controlioは、ネットワーク向けの包括的なWebフィルタリングソリューションを提供します。 許可ルールと拒否ルールのセットにより、次のように、必要なWebフィルタリングポリシーを作成できます。
・アラート
禁止されているサイトへのアクセス試行に関する電子メール通知を取得する
・HTTPSフィルタリング
facebook.comなど特定のサイトをブロックする
・コンテンツベース
HTMLキーワードでブロックするか、80以上のカテゴリで更新可能なドメインデータベースを使用する

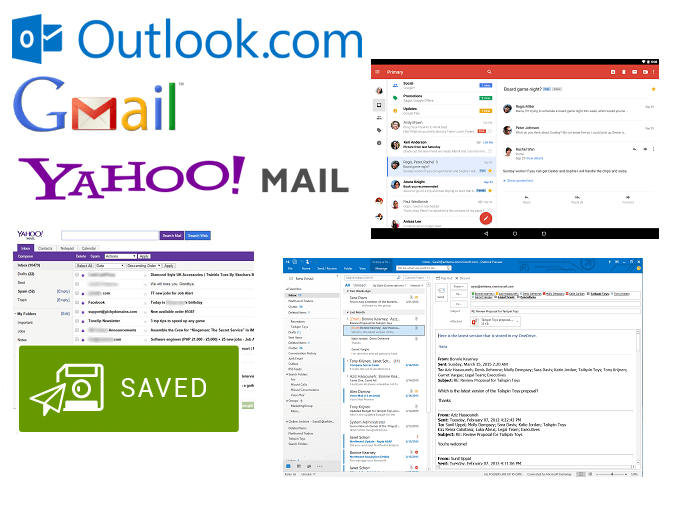
メールの監視
データ漏洩を見つけて防止する。当社の電子メール記録ツールは、重要な情報の漏洩を減らし、従業員の電子メール通信のより良いアイデアを得るのに役立ちます。
ハートコア タスクマイニング Controlioは、Gmail、Outlook.com 等のWebサービス、SMTPおよびPOP3プロトコル、およびMS OutlookからのMS Exchangeメッセージを介して送受信されるすべての電子メールメッセージをキャプチャして保存できます。
すべての電子メール情報(時間、差出人、宛先、件名、本文、添付ファイル)がキャプチャされます。 キャプチャされたメールを任意のパラメーターでフィルタリングしたり、キーワードのメッセージを検索したりできます。
ハートコア タスクマイニング Controlio その他の機能
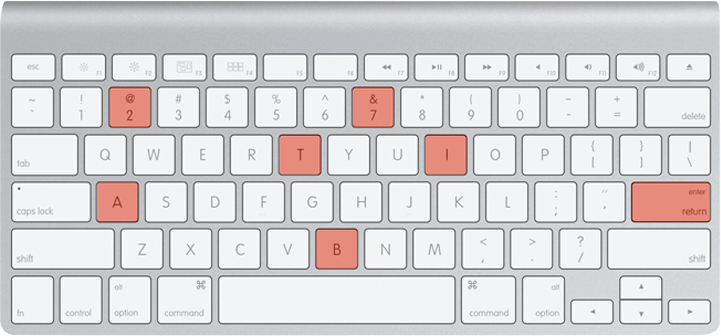
キーストローク
必要なアイテム(ユーザ、コンピューター、Webサイト/アプリケーション名、ウィンドウタイトル、日付/時刻)がすべて記録され、クイック検索とデータフィルタリングに使用できます。
Webブラウザ、電子メールクライアント、MS Officeアプリなどからキーストロークをキャプチャするプログラムのリストを指定できます。
レポートには、文字/数字と特殊キーの両方が記録され、便利で読みやすいスタイルで表示されます。